
Examples of Seasmoke fm outputs
The following examples of output are taken from the Executive Summary
The Executive Summary has been designed as a complete summary of the business and would be especially useful to interested parties such as management, board members and external investors (as a precursor to reviewing the entire financial model)
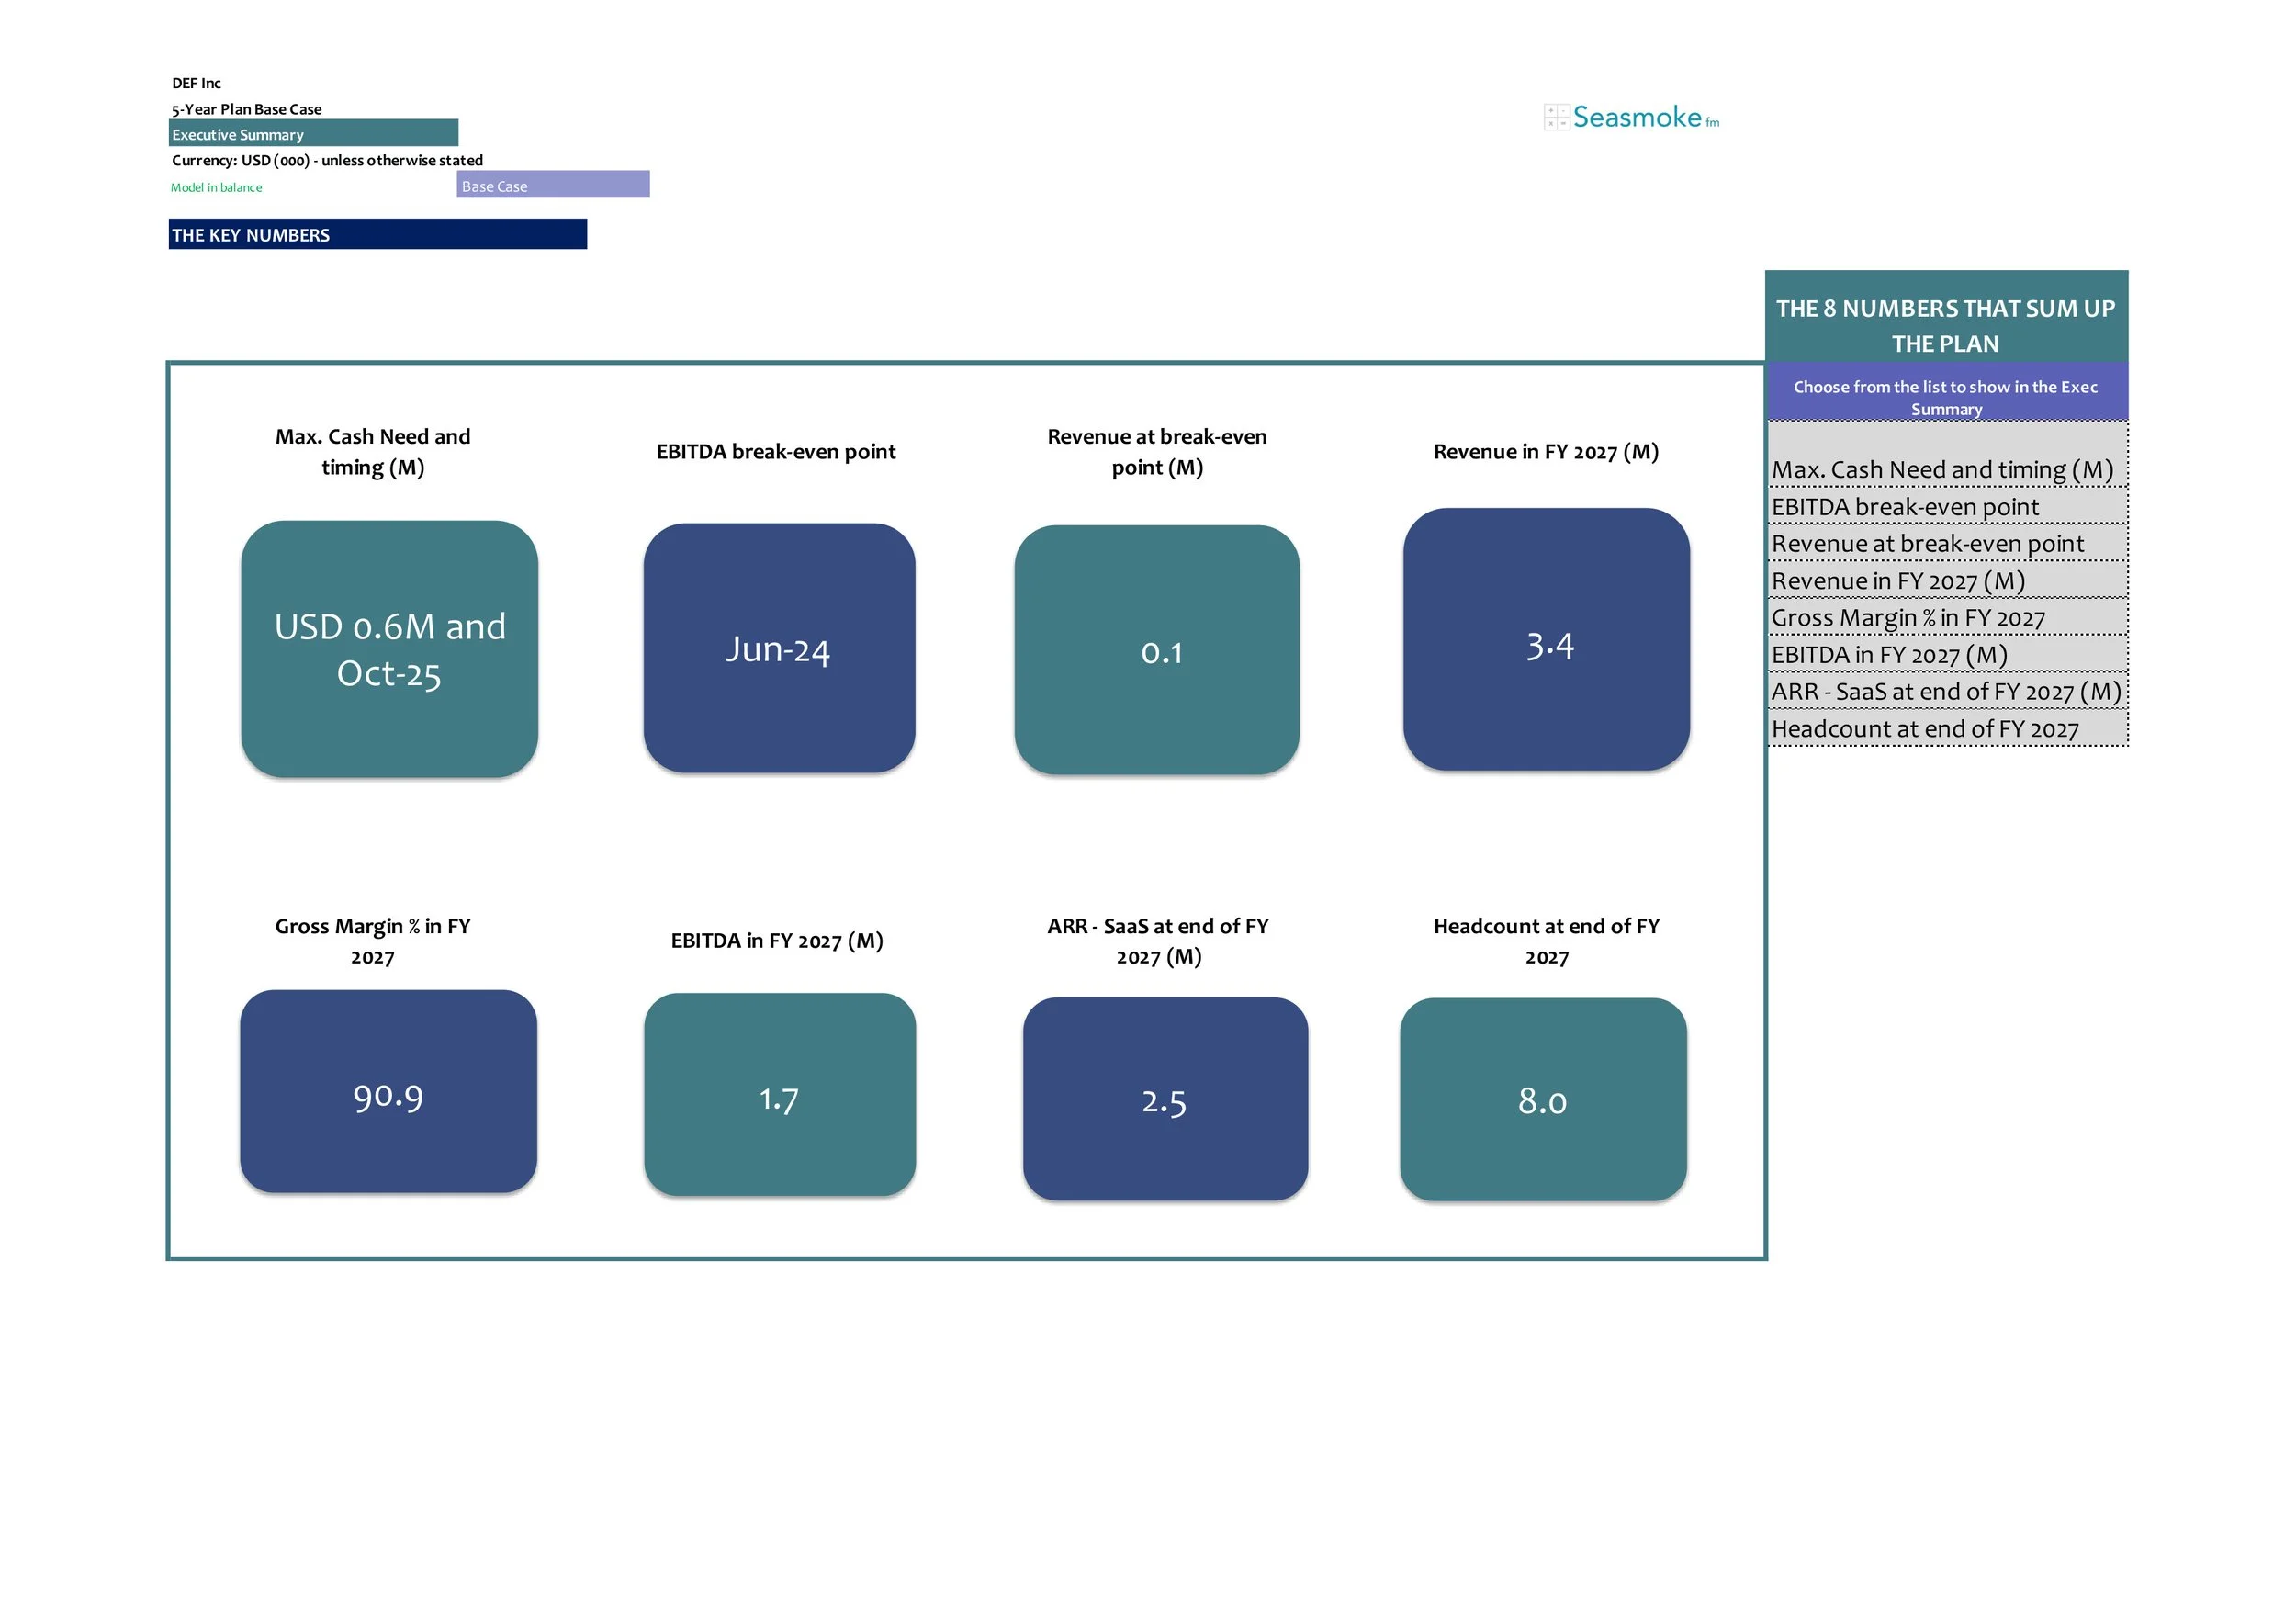

This is the 1st page of the Executive Summary
Choose from the options in the drop-down menu to the right to highlight the 8 numbers that you wish to bring to a reader’s attention
The key financial outputs presented graphically - helps to check whether the trend looks reasonable. These can easily be customised if needed
This is also available for more categories on a separate tab and on a monthly and quarterly basis
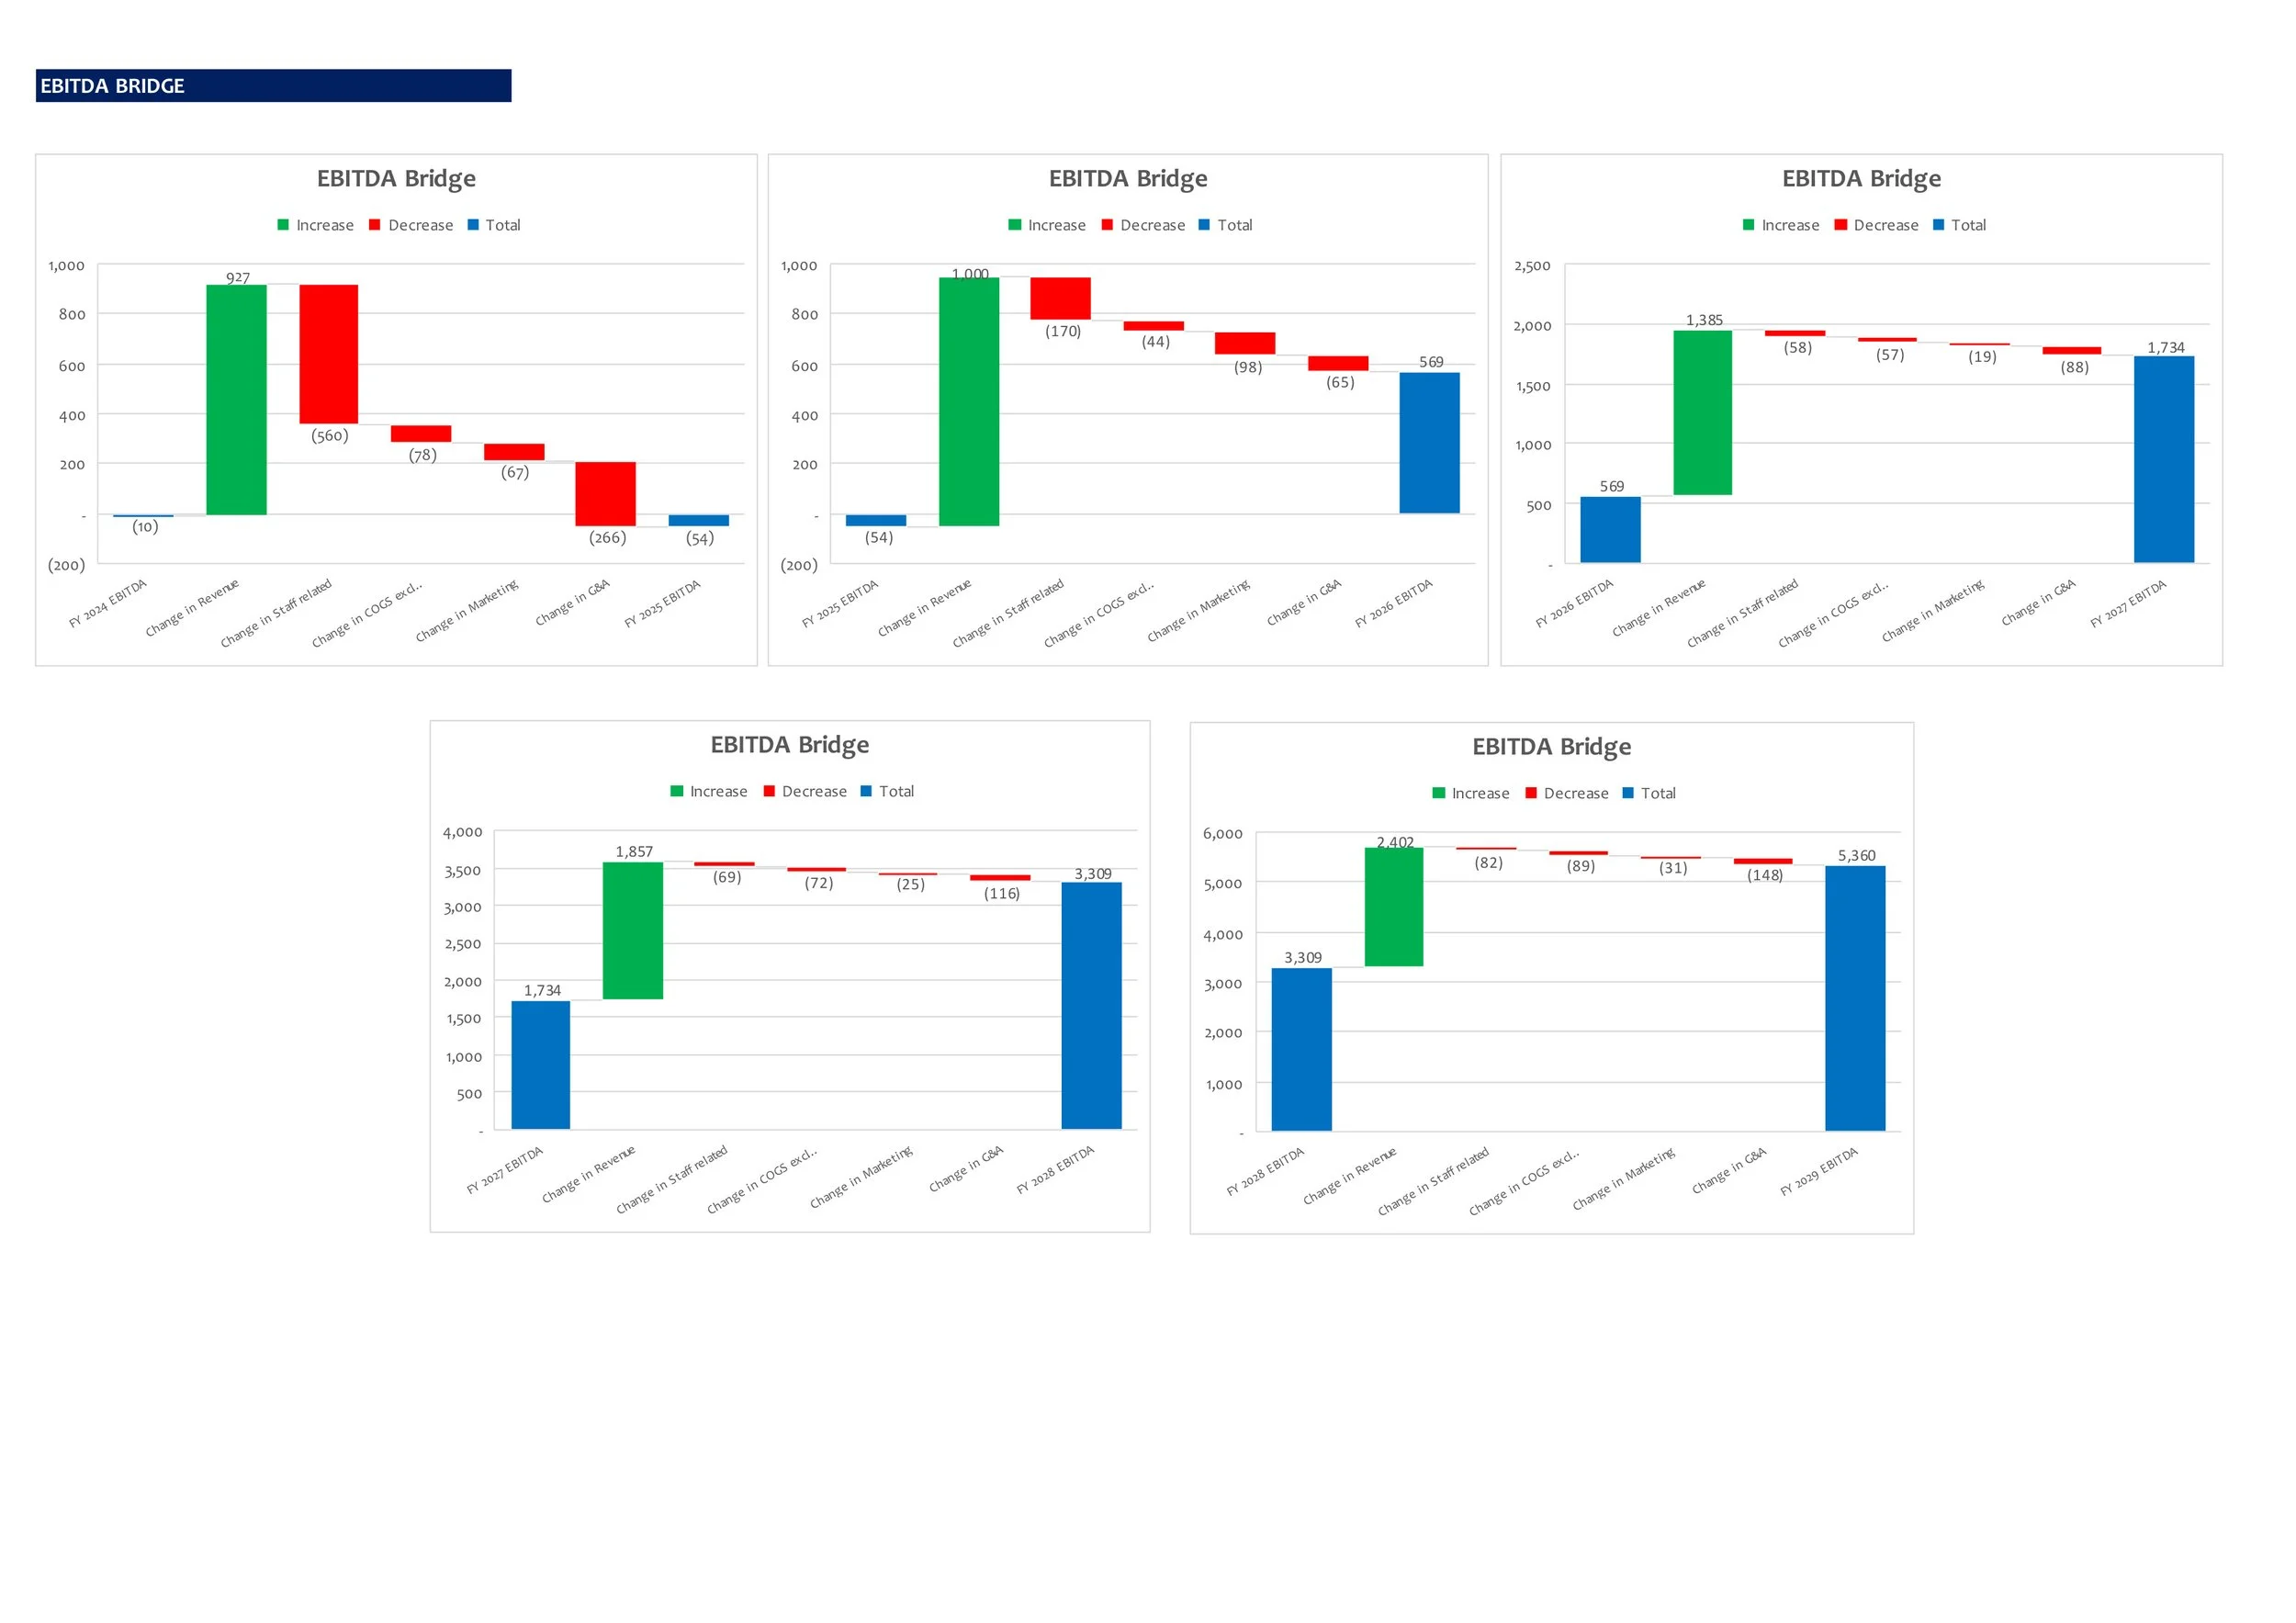
Automated EBITDA bridge graphs - great for story-telling on the changes to EBITDA each year
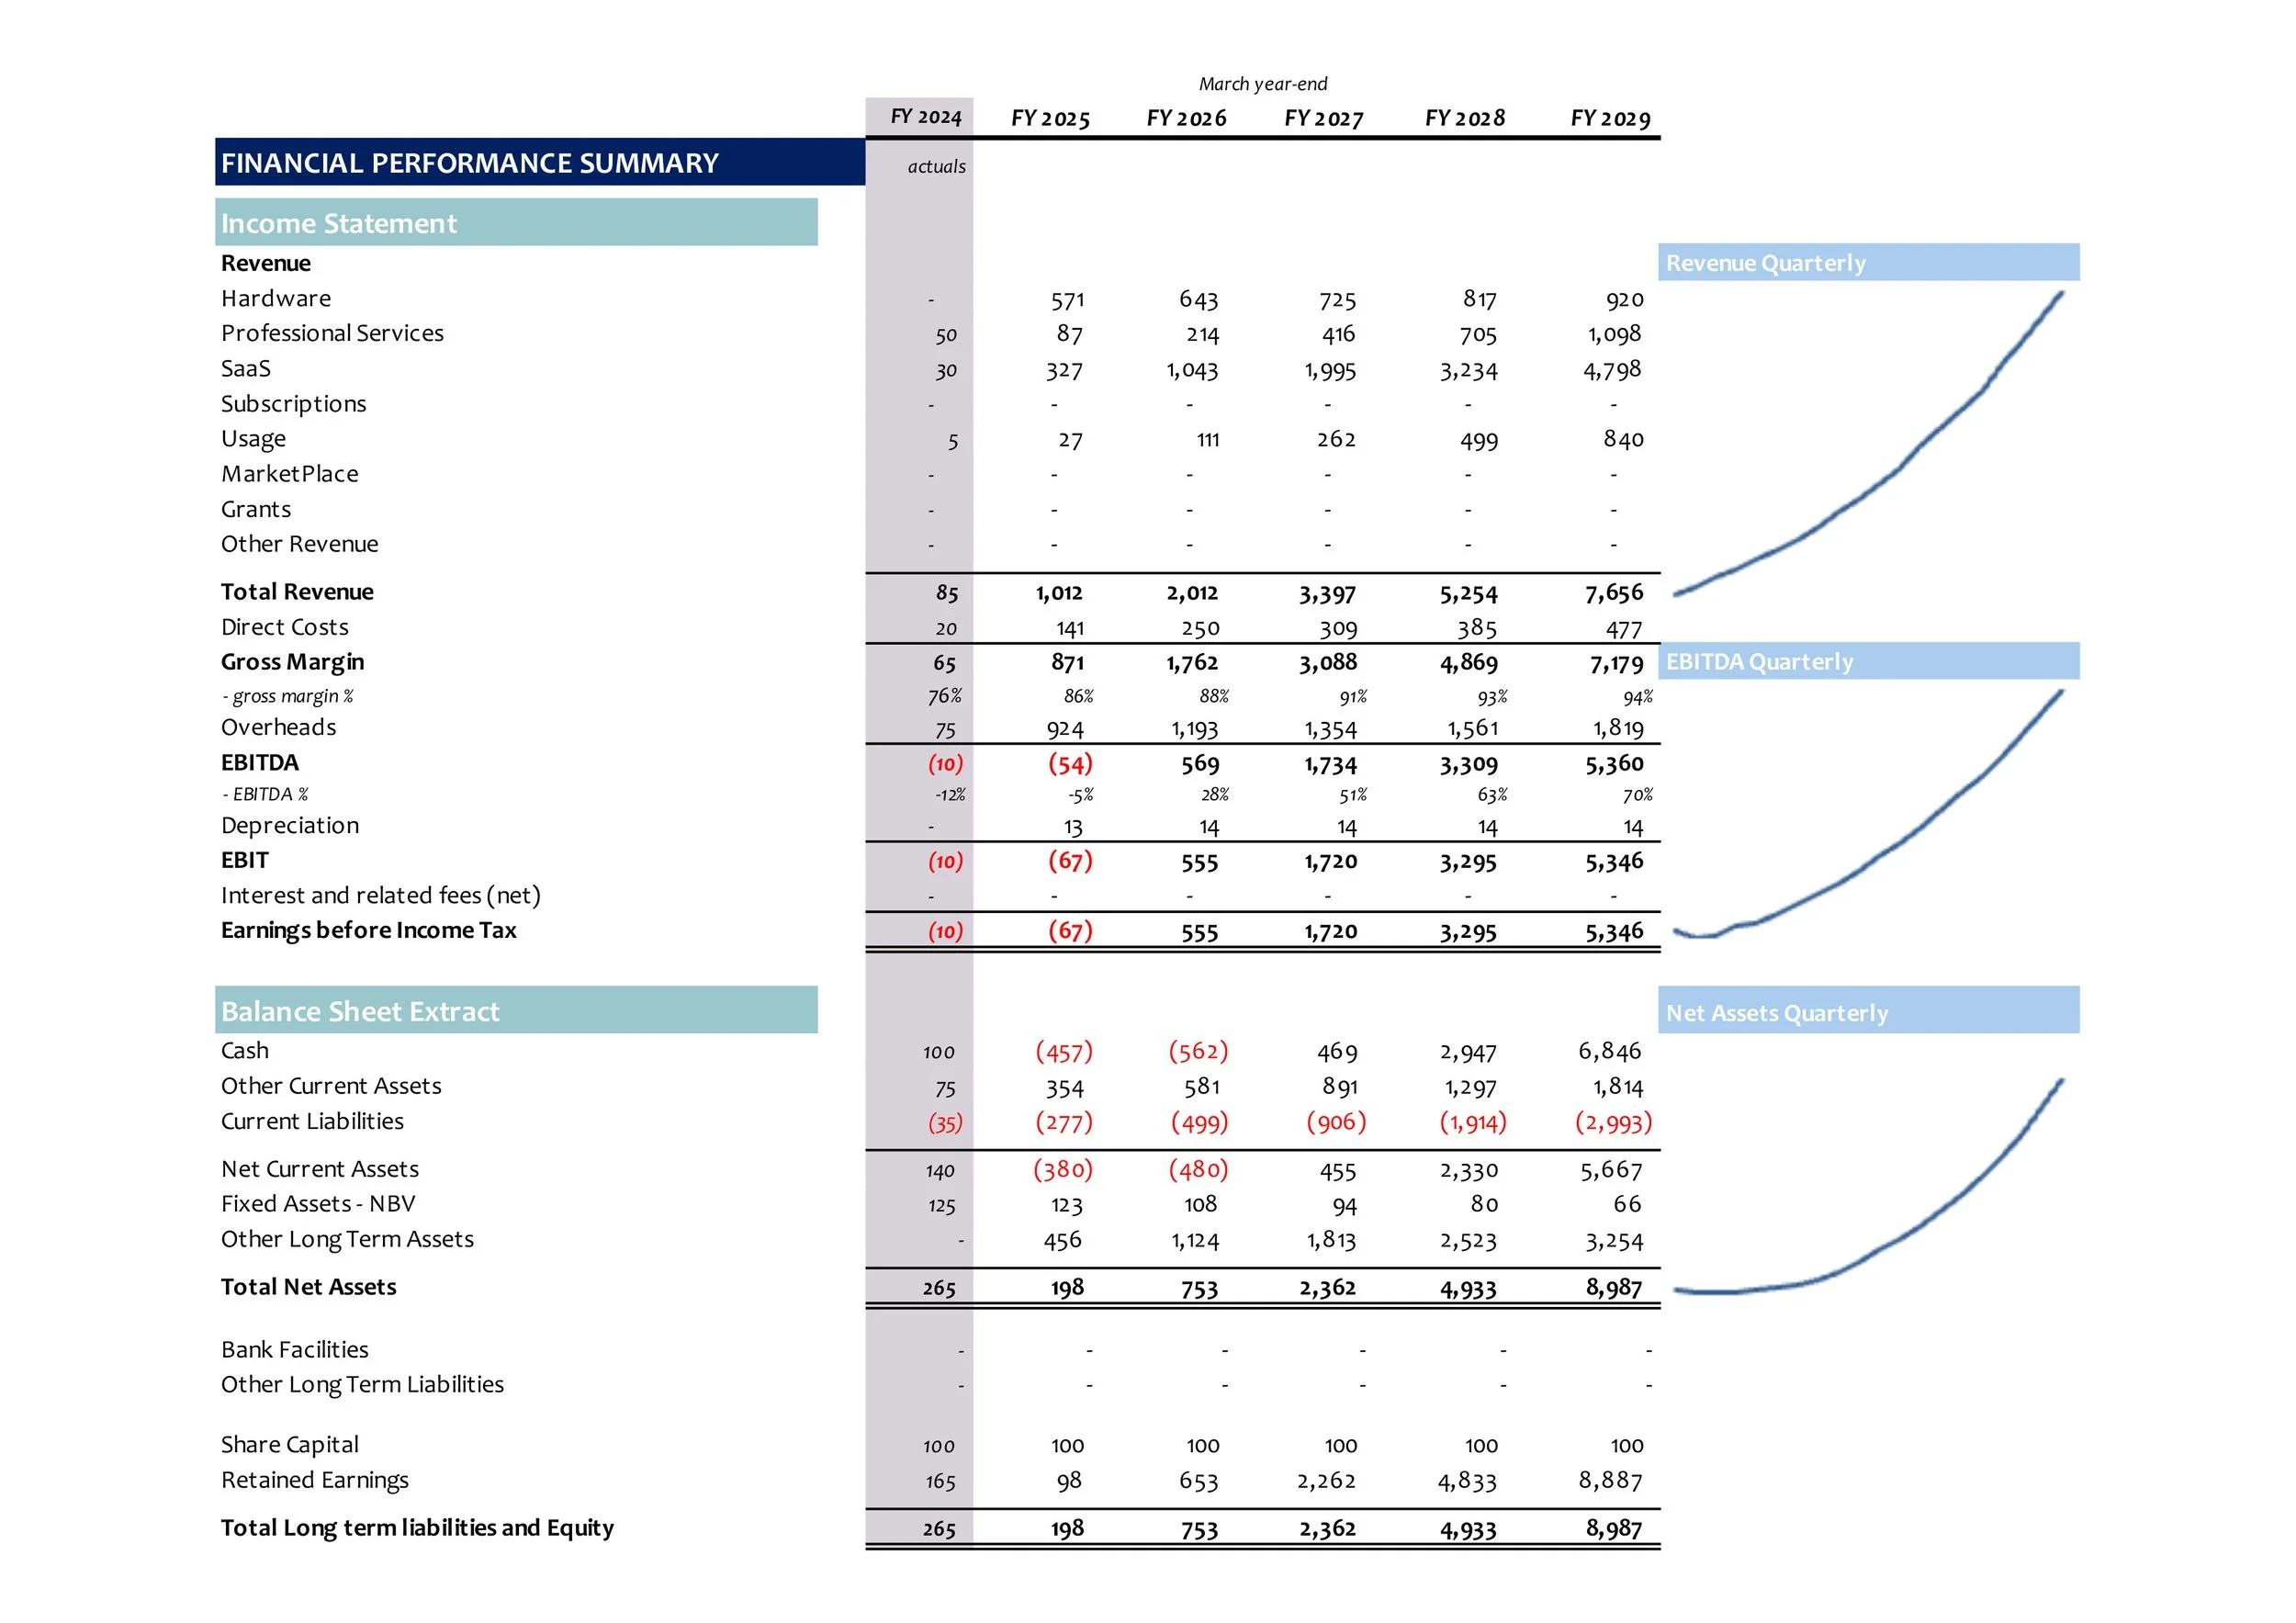
This is the financial performance section of the Executive Summary
It’s essentially a summary of the Profit & Loss Account and Balance Sheet
Alongside it, you have quarterly graphical trends for the key projections using Excel’s Sparklines
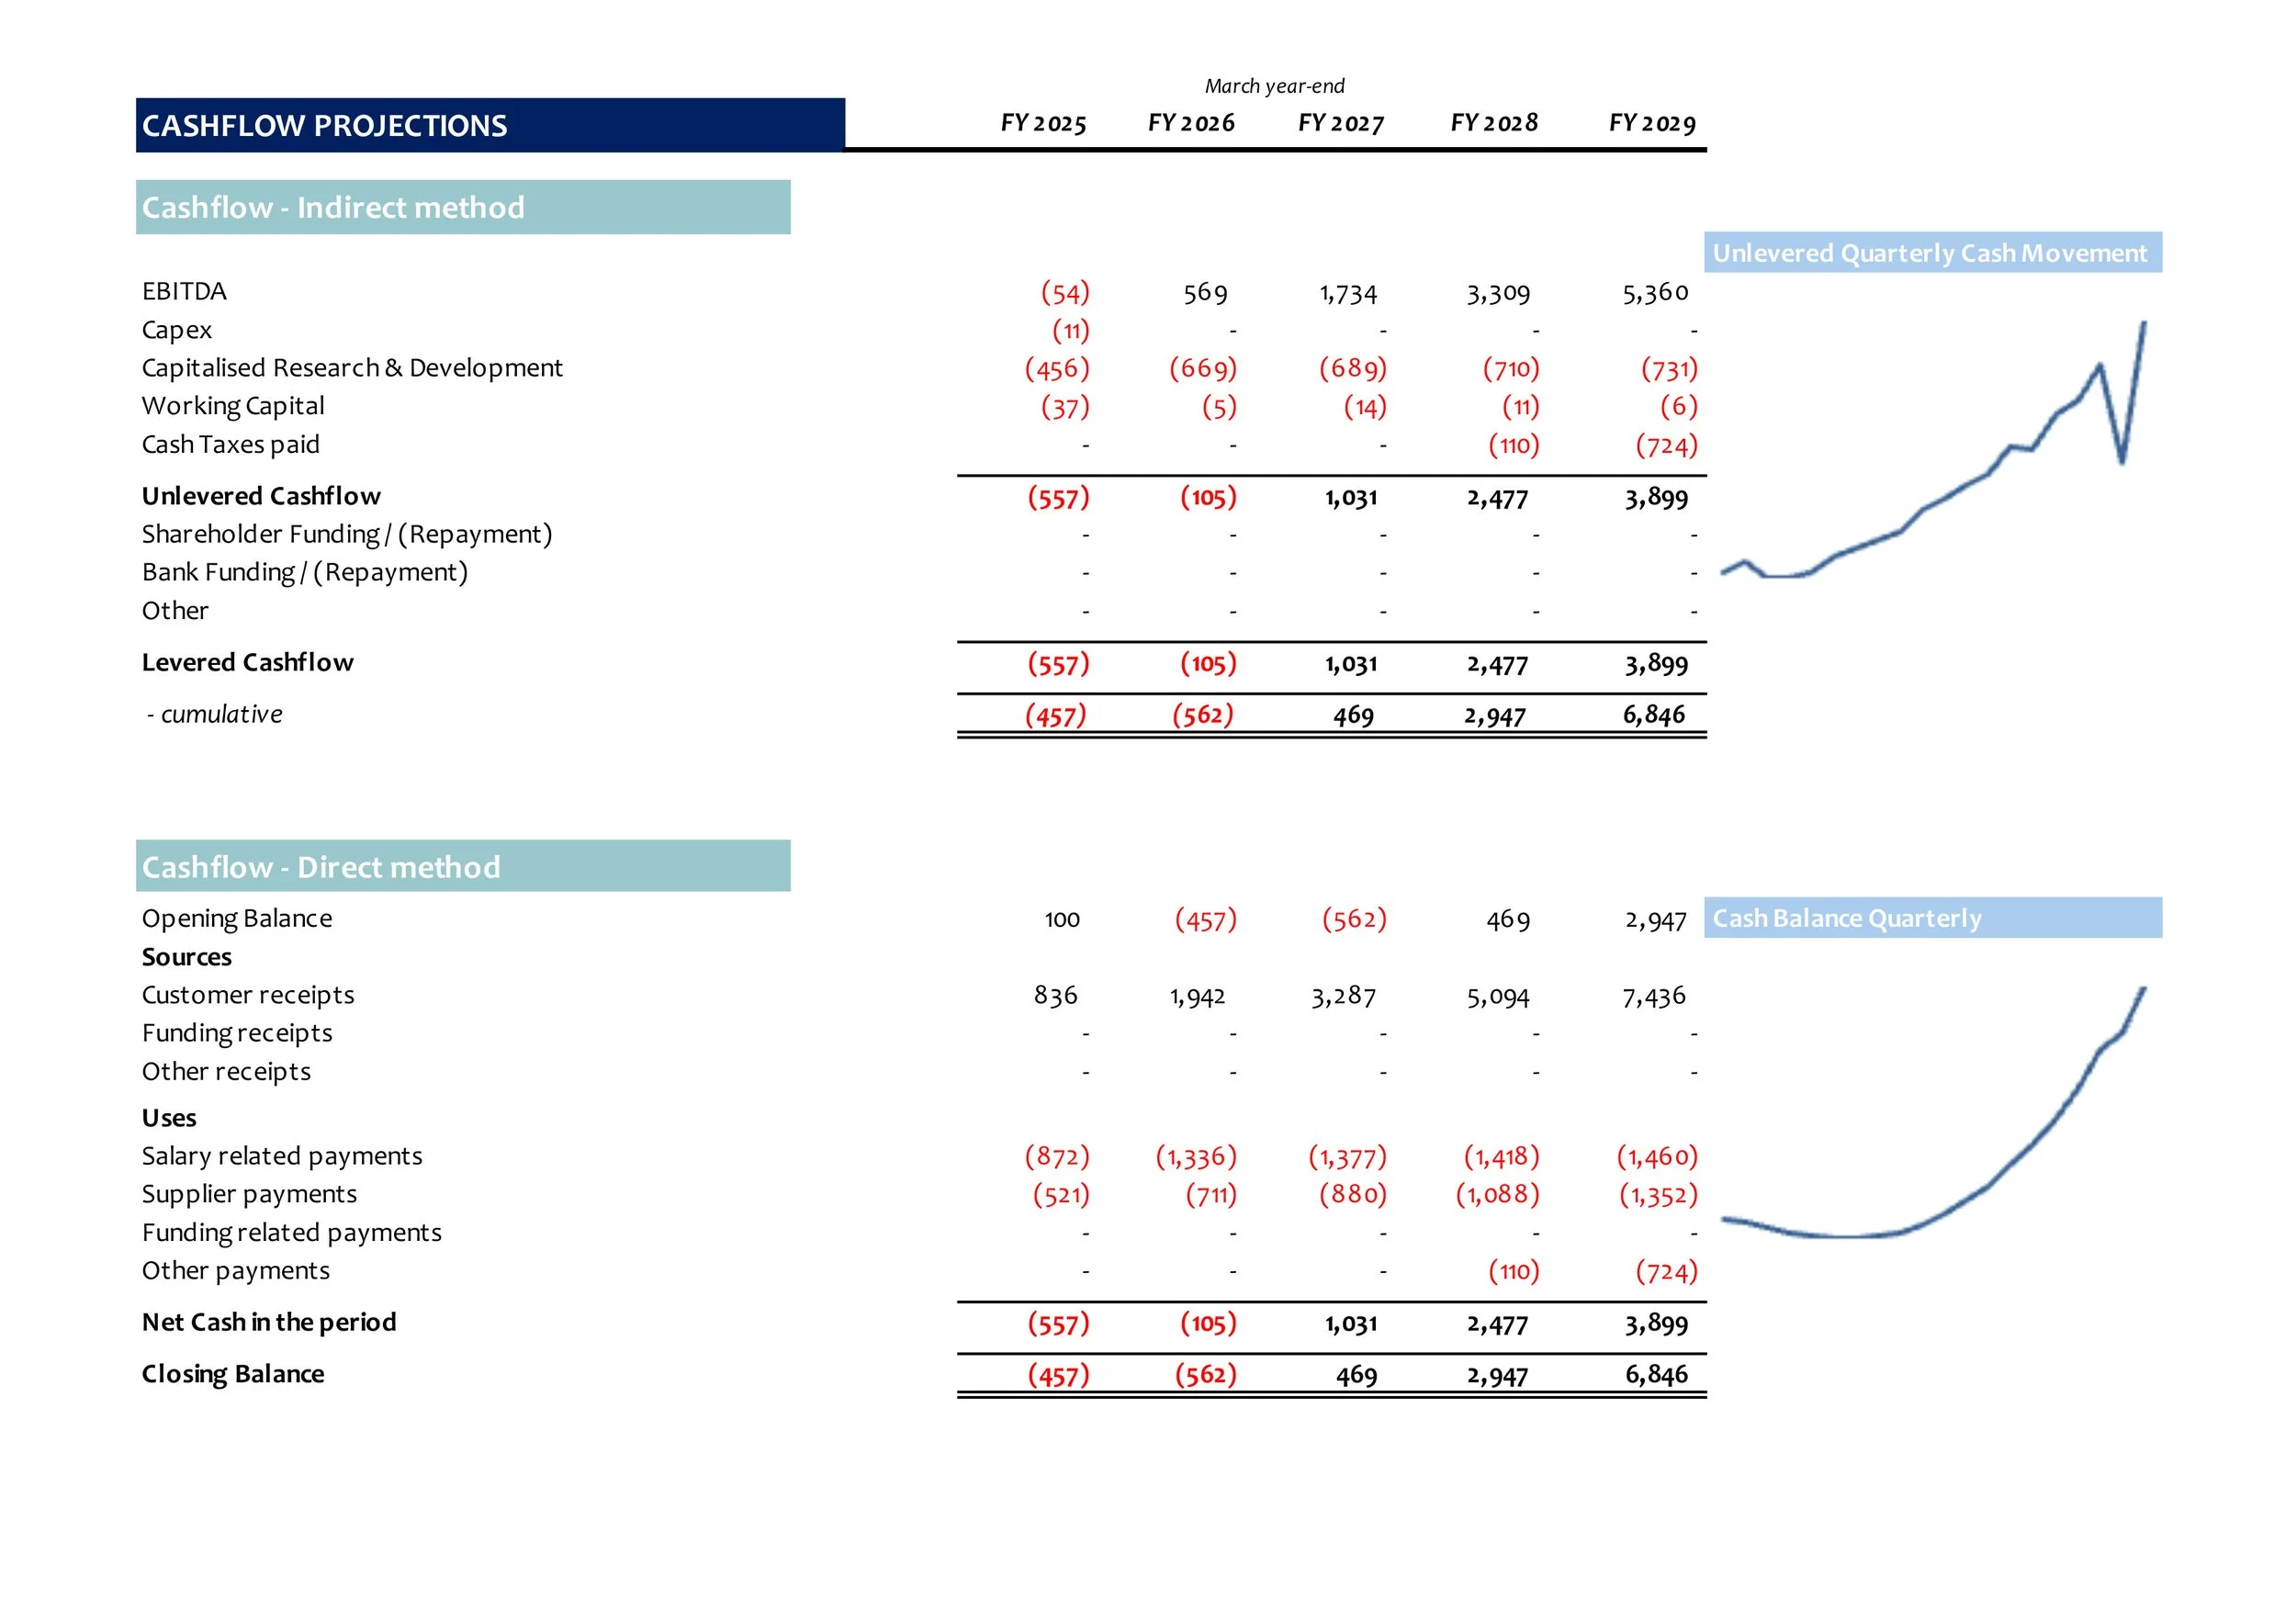
You’ll see here that the cashflow summary is presented in two ways - an indirect method (i.e using the Balance Sheet) and a direct method (using sources and uses from the cashflow statement itself)
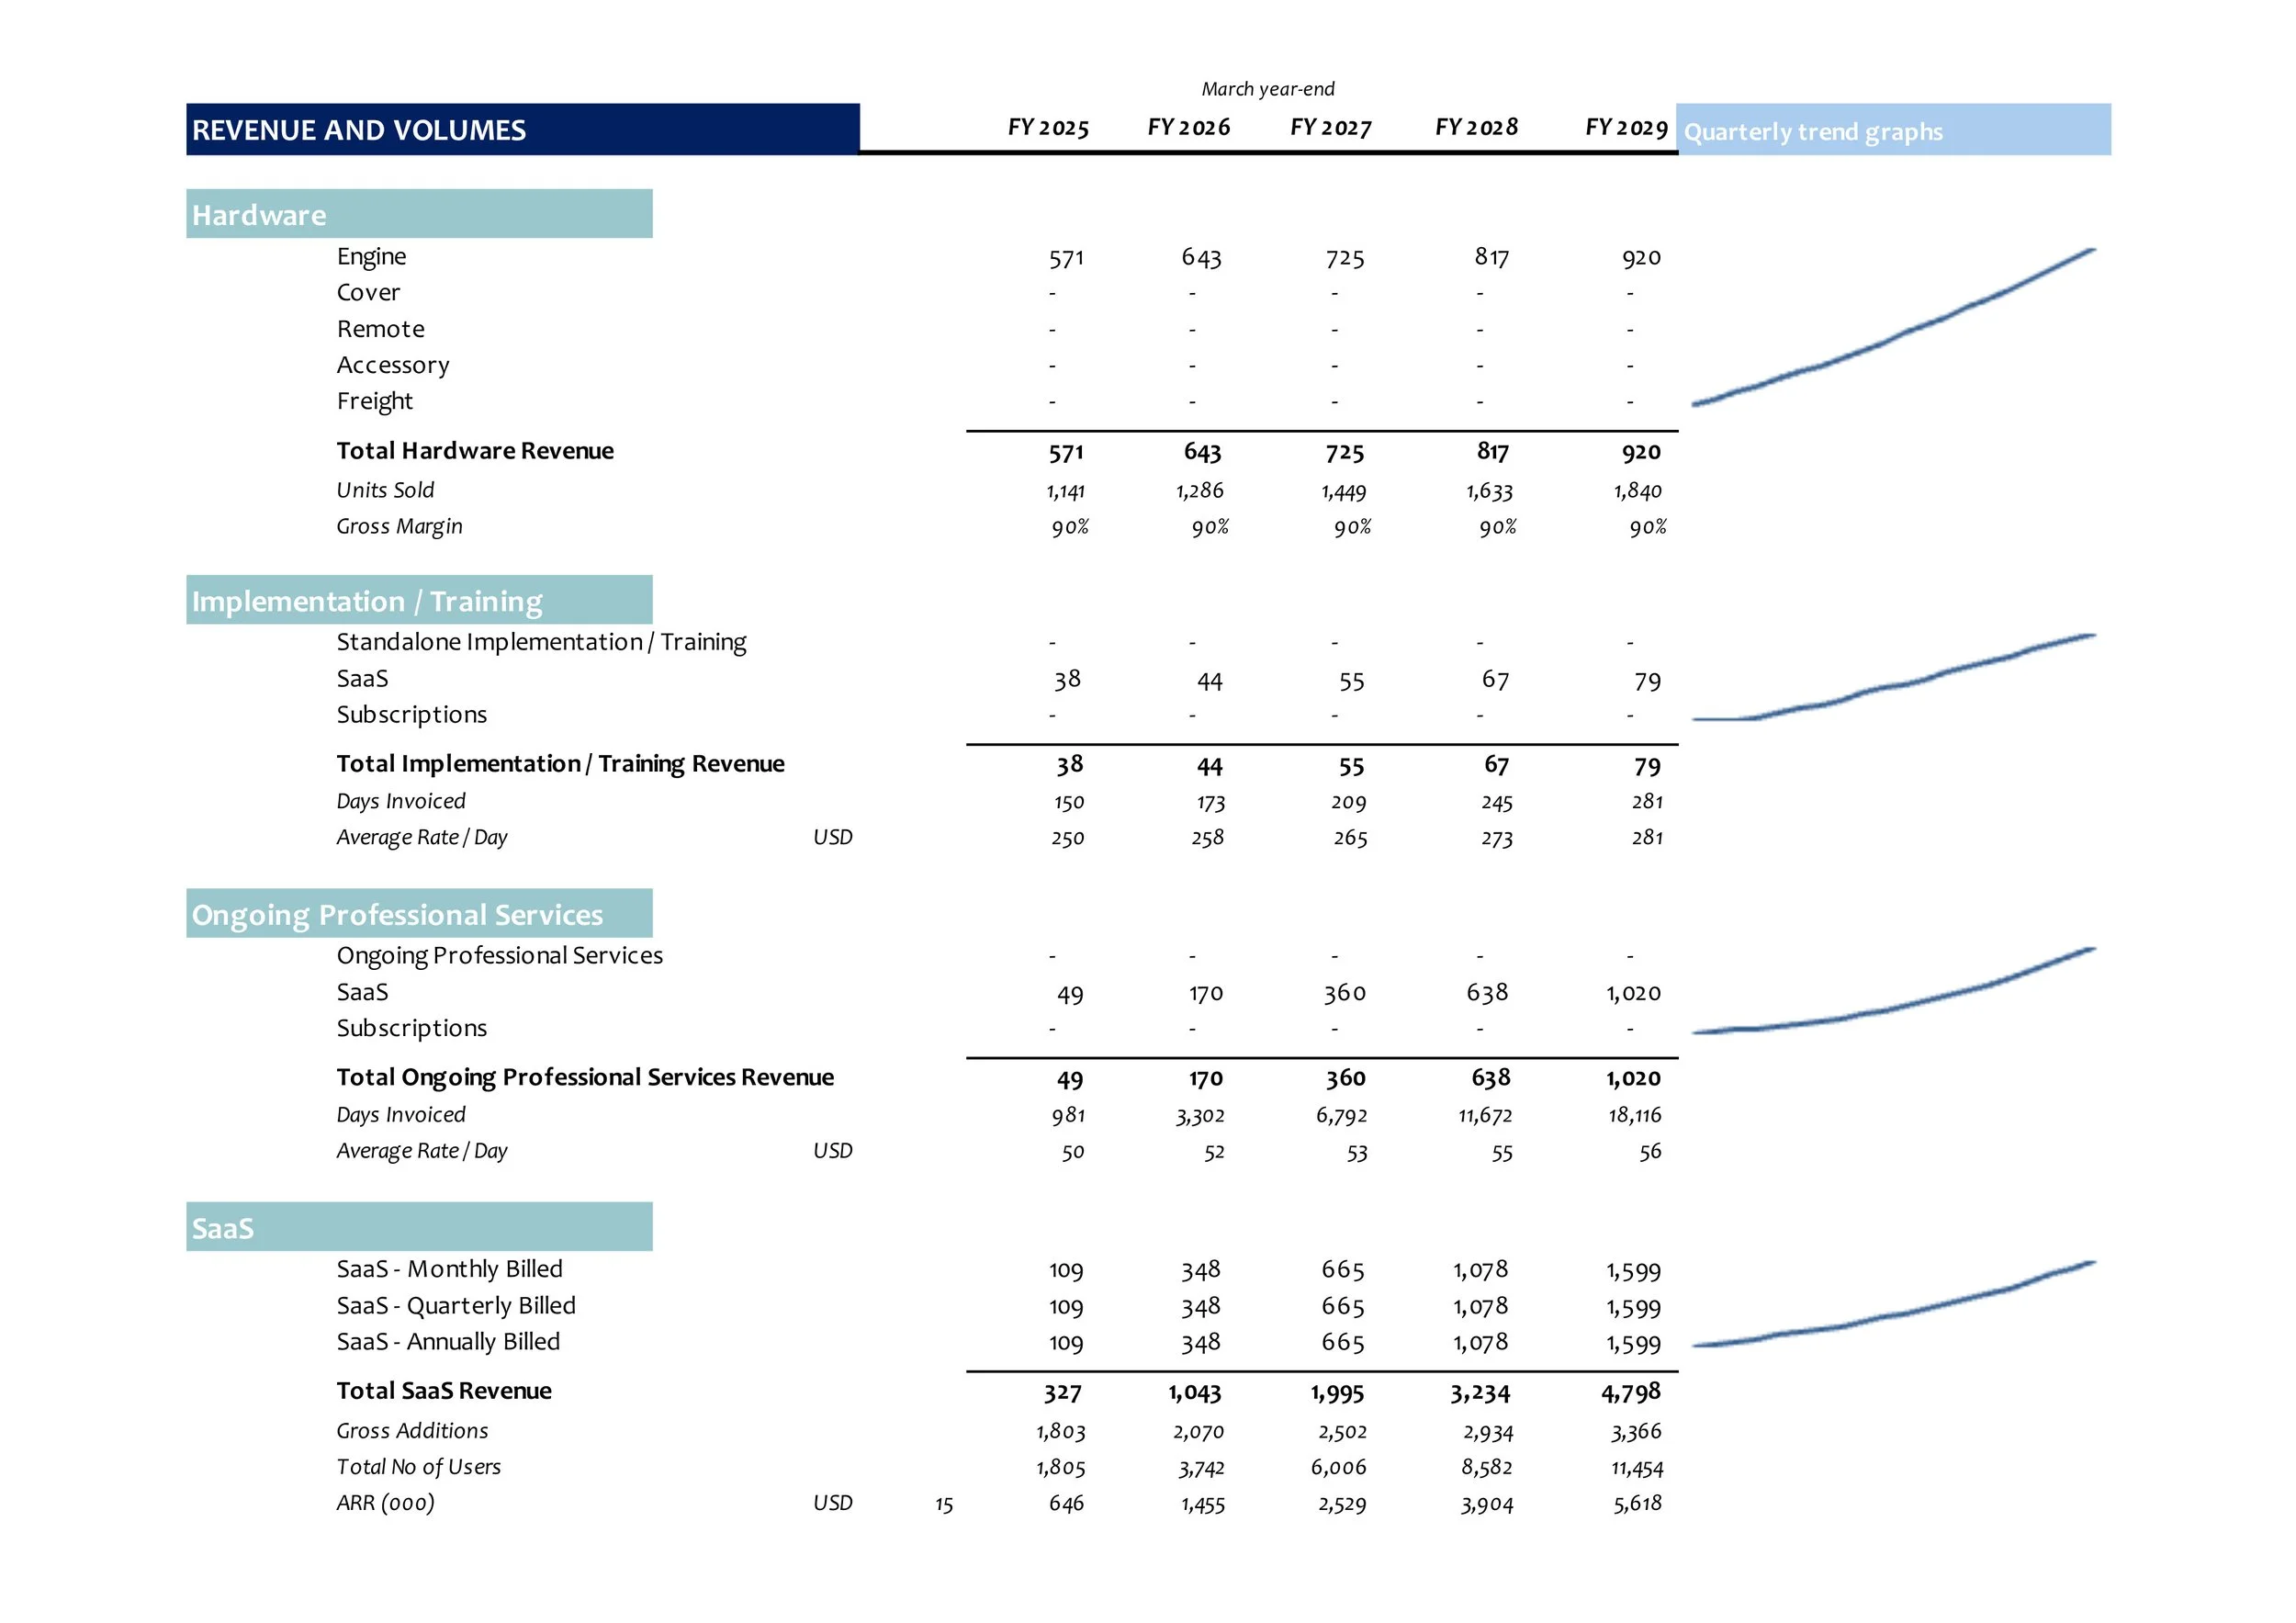
This is a summary of the revenue and relevant volumes for each of the products already included in the tool. This is an example of page 1 of this section - the other products are on page 2 (not shown here)
The revenue models already built into the tool are: Hardware; Implementation/Training; Ongoing Professional Services; SaaS; Subscriptions; Usage-Based Revenue; MarketPlace; Grants; Other Revenue
Note that the SaaS revenue product section has information on the monthly, quarterly and annual billing revenue streams as well
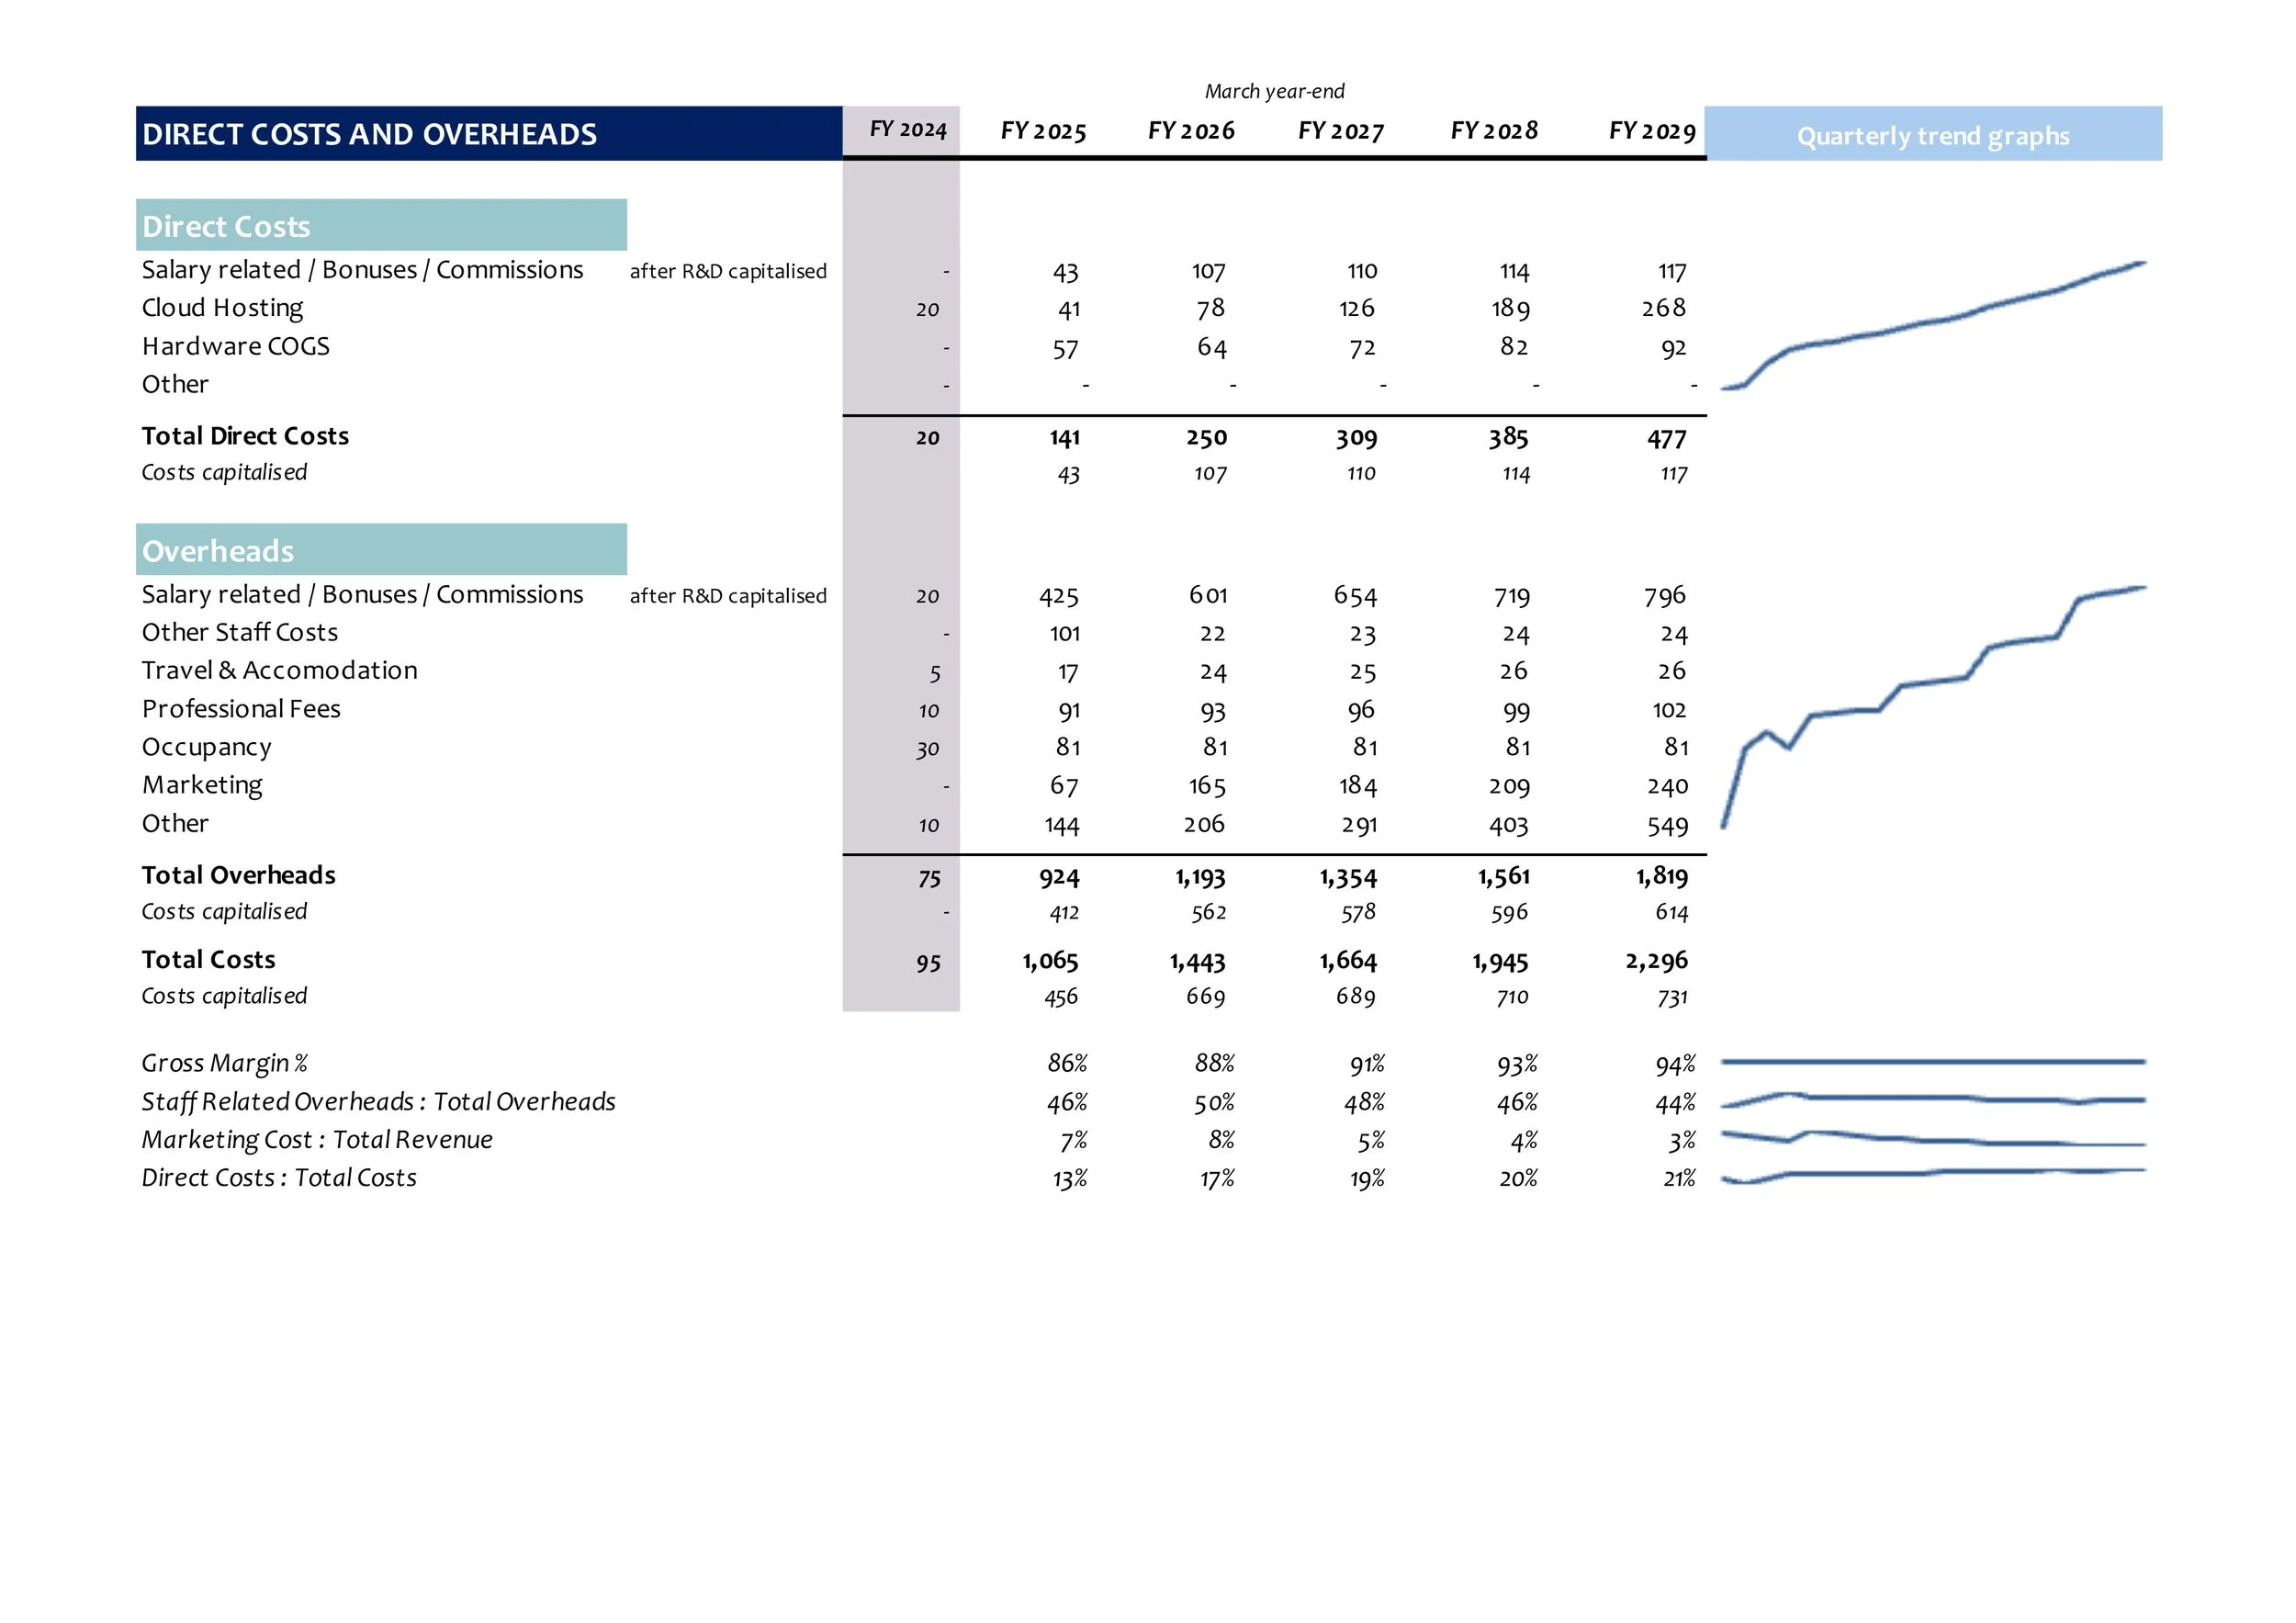
This is a summary of Direct costs and Overheads from the Profit and Loss Account
Note that any capitalised salary-related costs are netted off the costs shown here and taken to the Balance Sheet with Fixed Assets
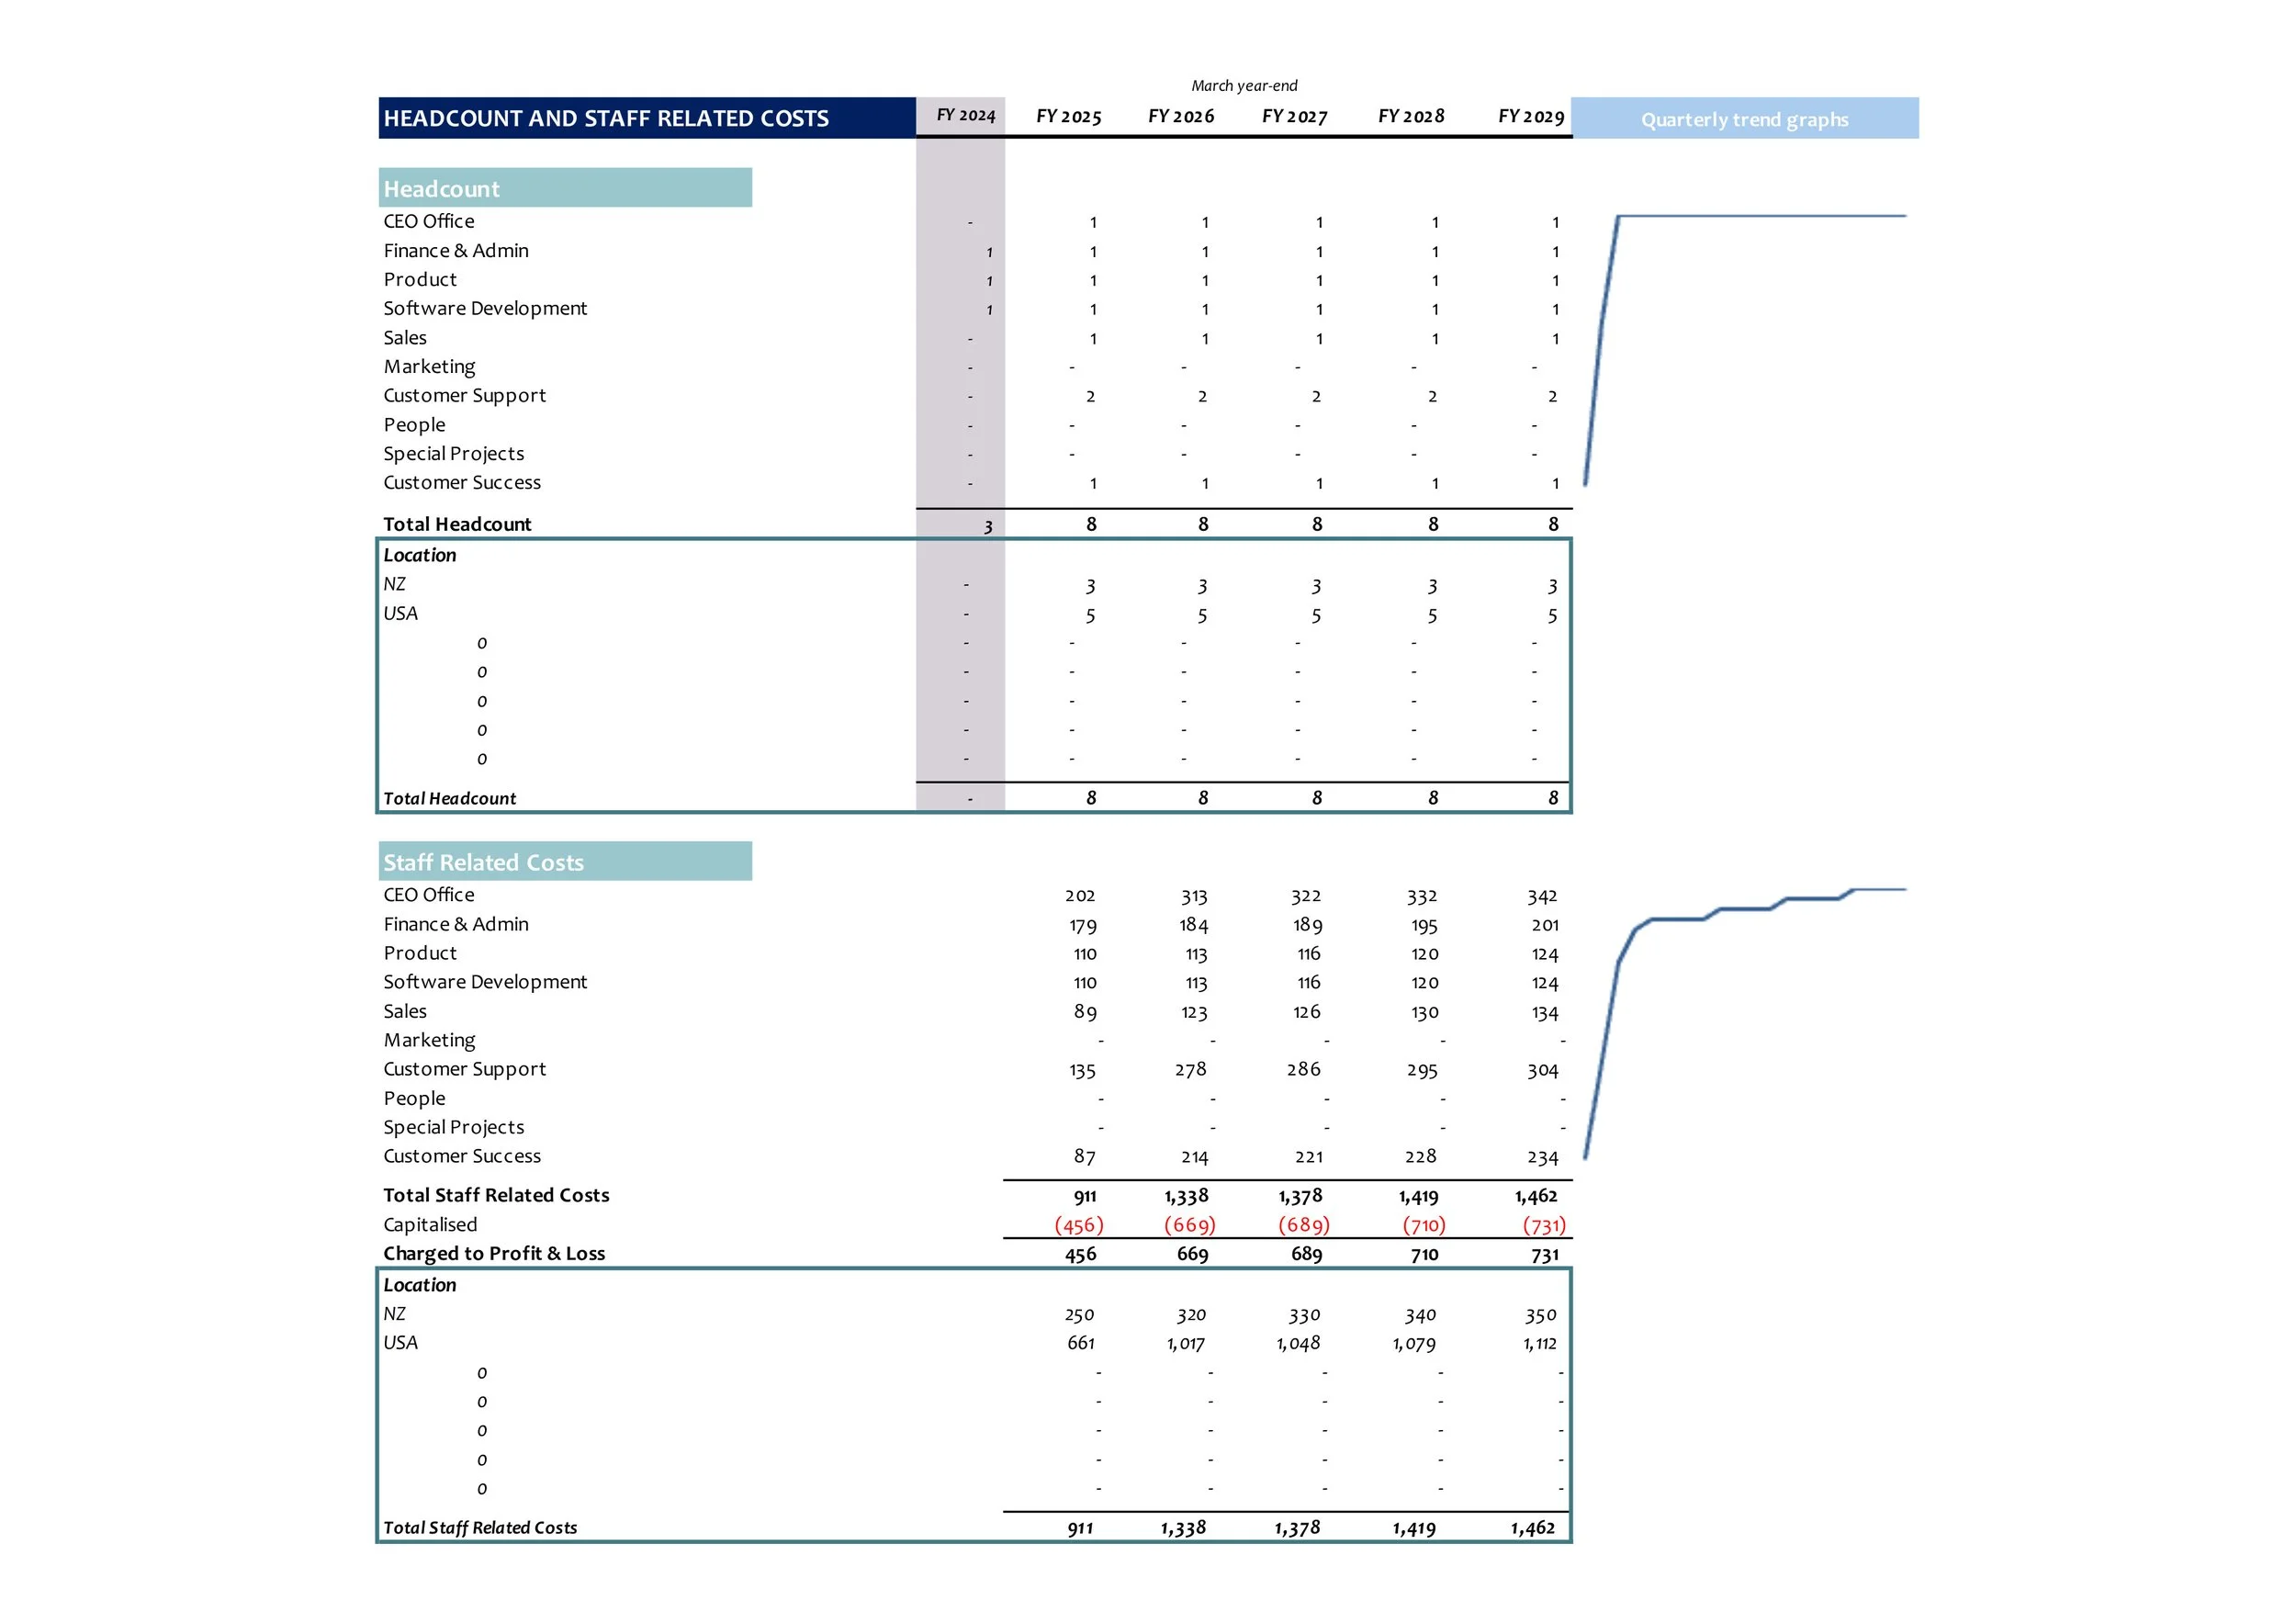
This is a headcount and salary-related costs summary - it is shown at the department level (9 departments) and summarises up to 20 cost centres
The summary also shows the location of the headcount / cost
The costs and headcount are BEFORE any capitalisation has taken place and therefore provides a full overview of the people resourcing within the business
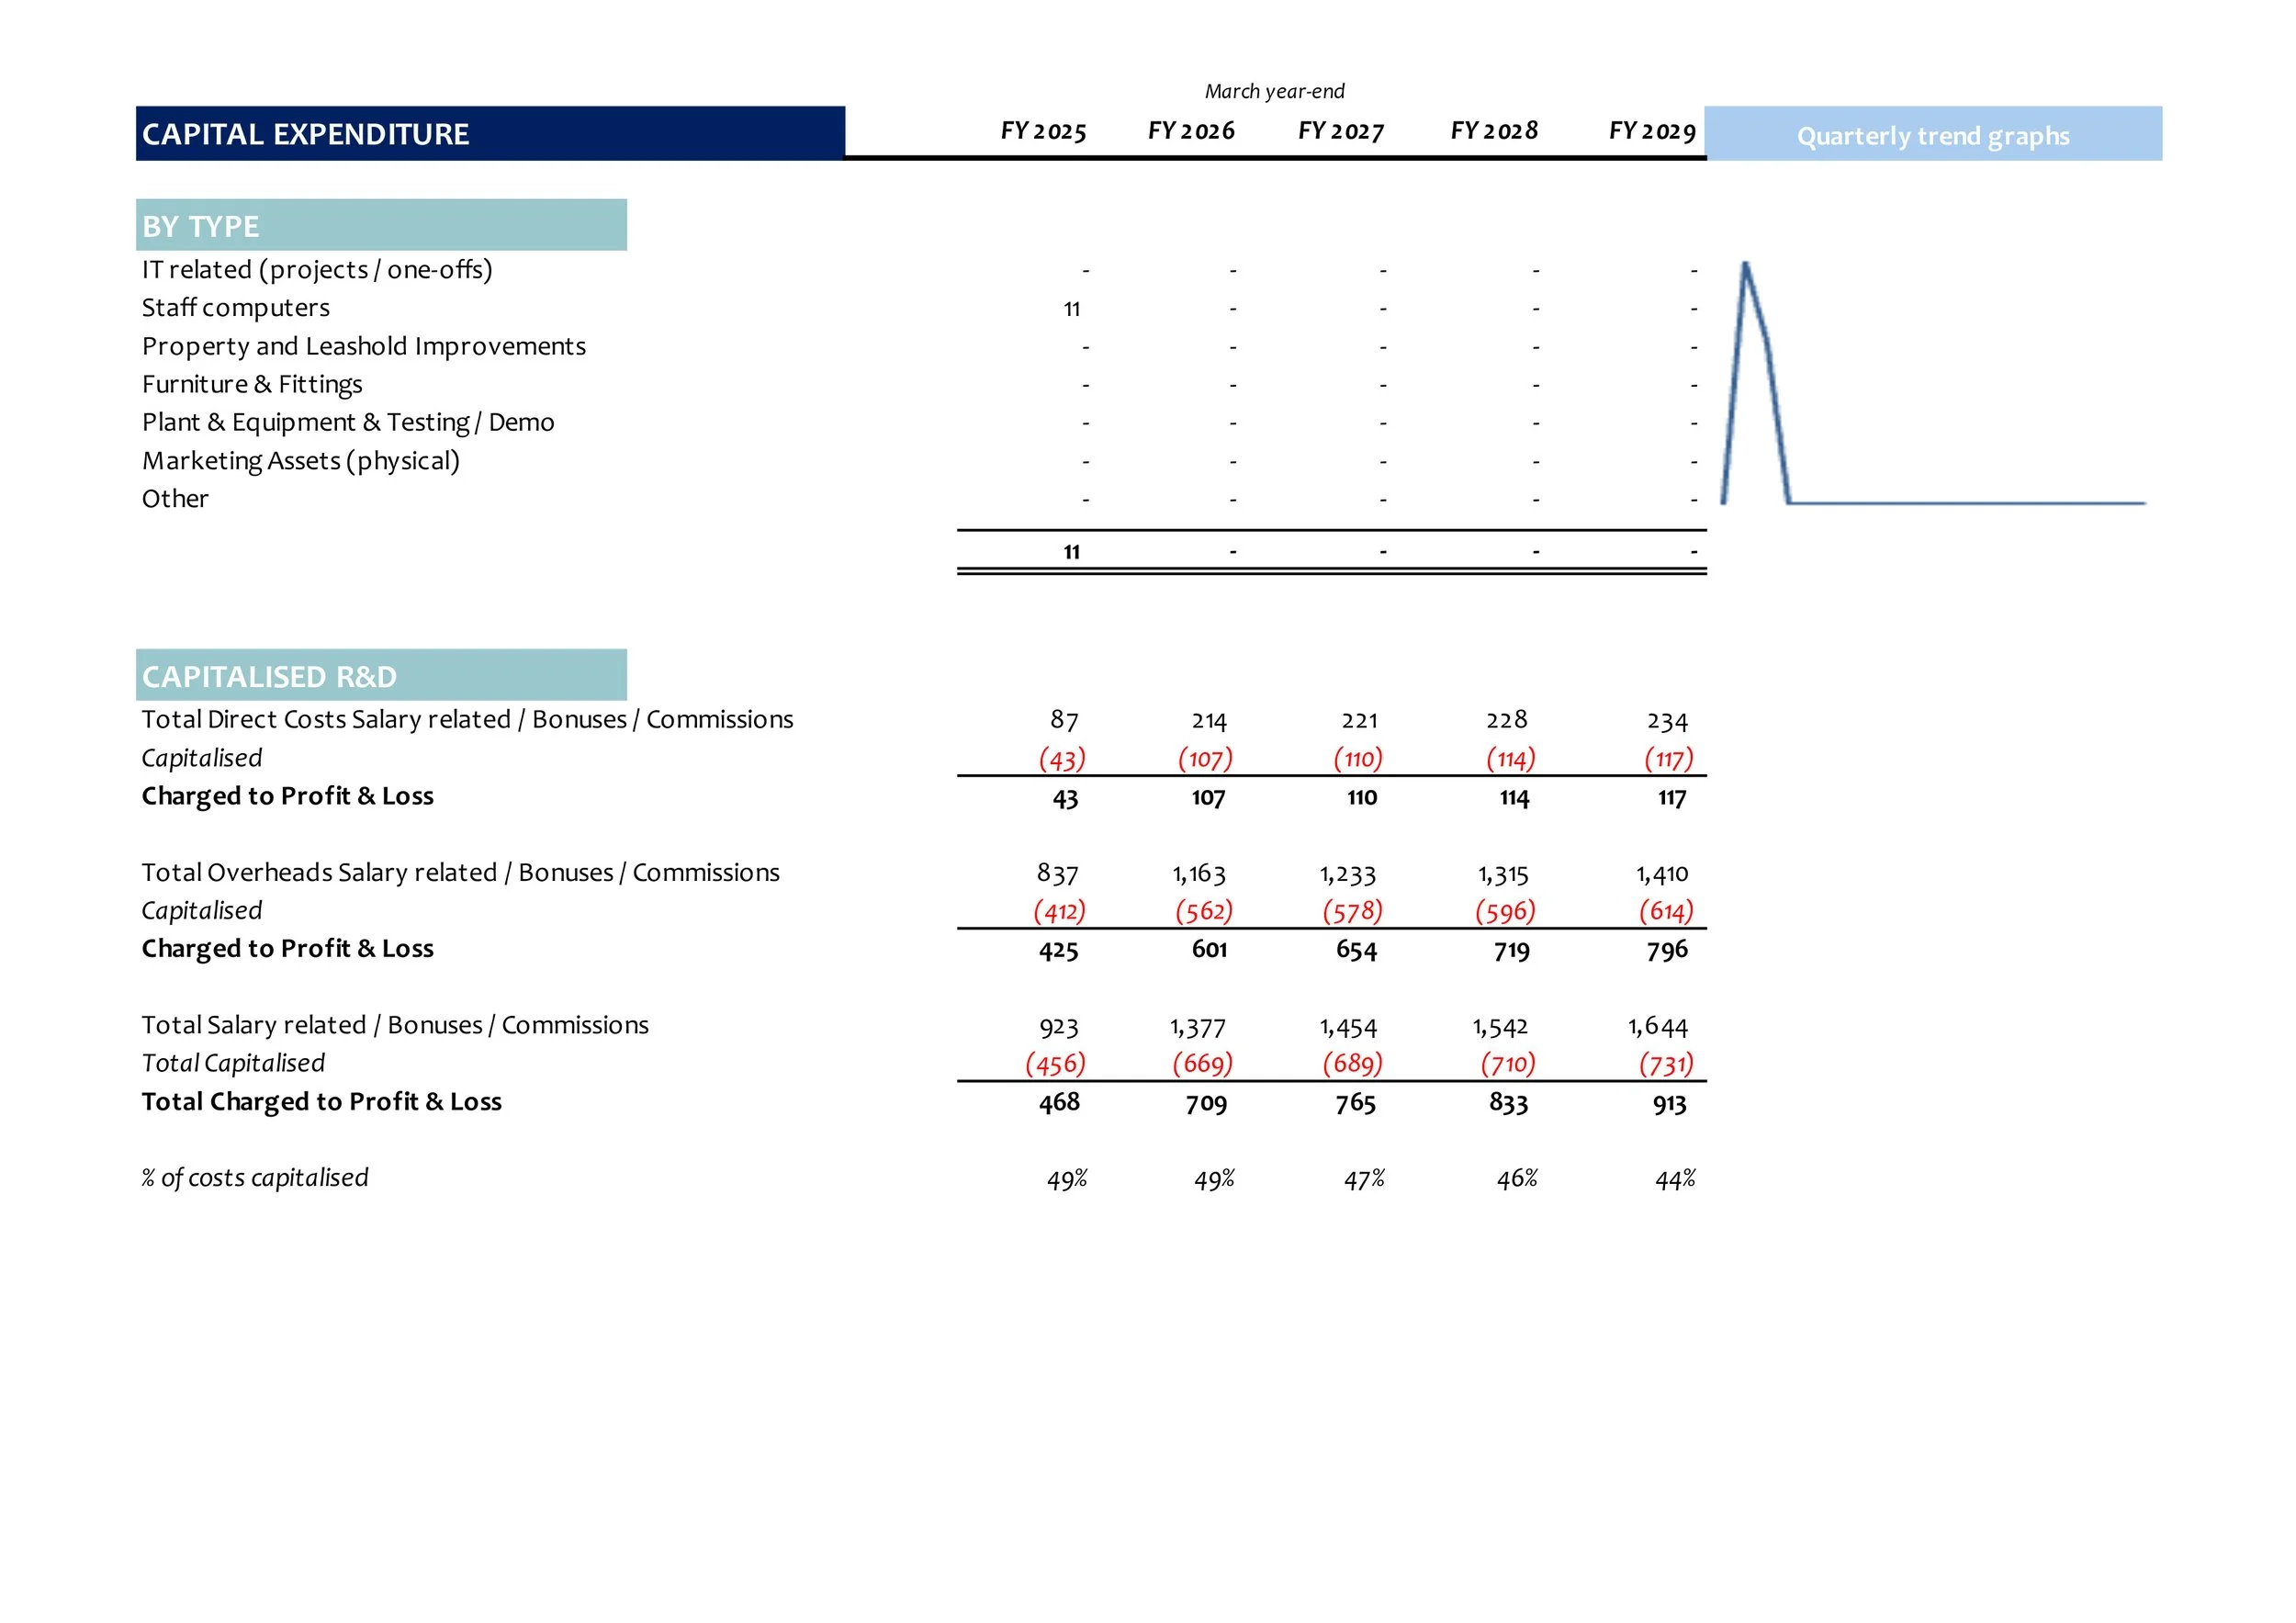
This is a capital expenditure summary, including the capitalised costs section
Note that the capitalised costs can appear in either Direct Costs or Overheads, depending on where the particular cost centres that have been capitalised are allocated